Back to courseware
[Use arrow keys to navigate, "s" to show speaker notes, and "f" for fullscreen.]

Christine Doig
Data scientist
Netflix

Ian Greenleigh
Marketer
data.world

Sharon Brener
Product designer
data.world

Patrick McGarry
Community builder
data.world
Special thanks to Alexander Egorenkov. Author of “How to ask questions data science can solve” medium.com/@codefluently

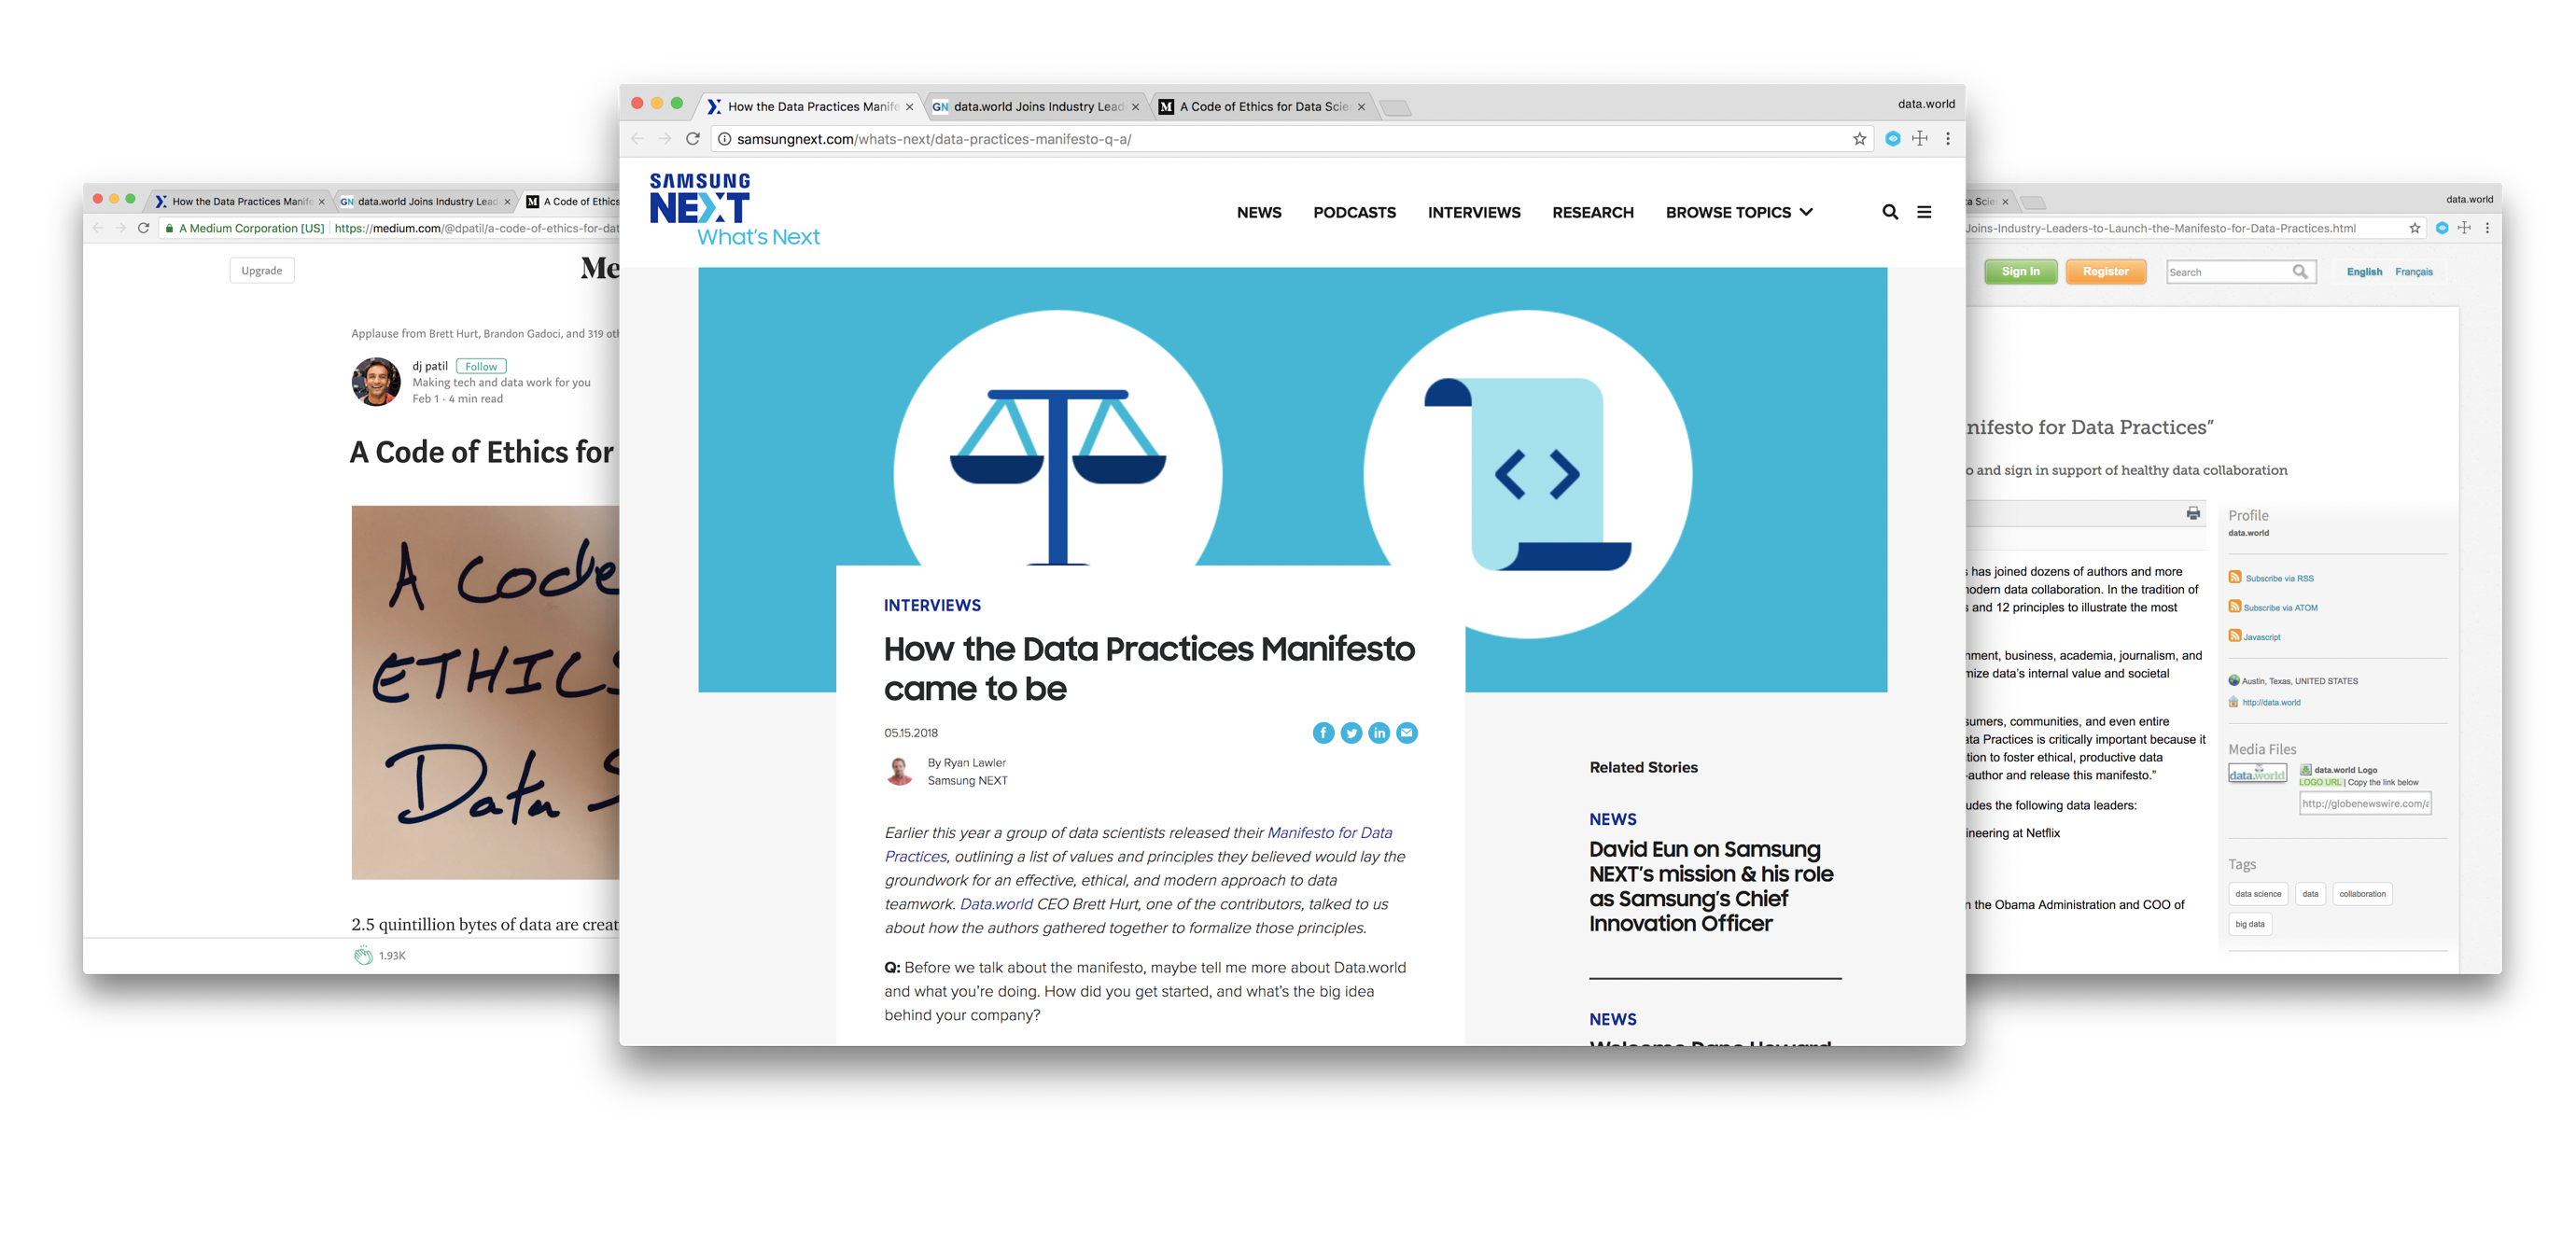
Manifesto for Data Practices

Data Teamwork Exercises

Your data toolchain + data.world
What set of values and principles describes the most effective, ethical, and modern approach to data teamwork?
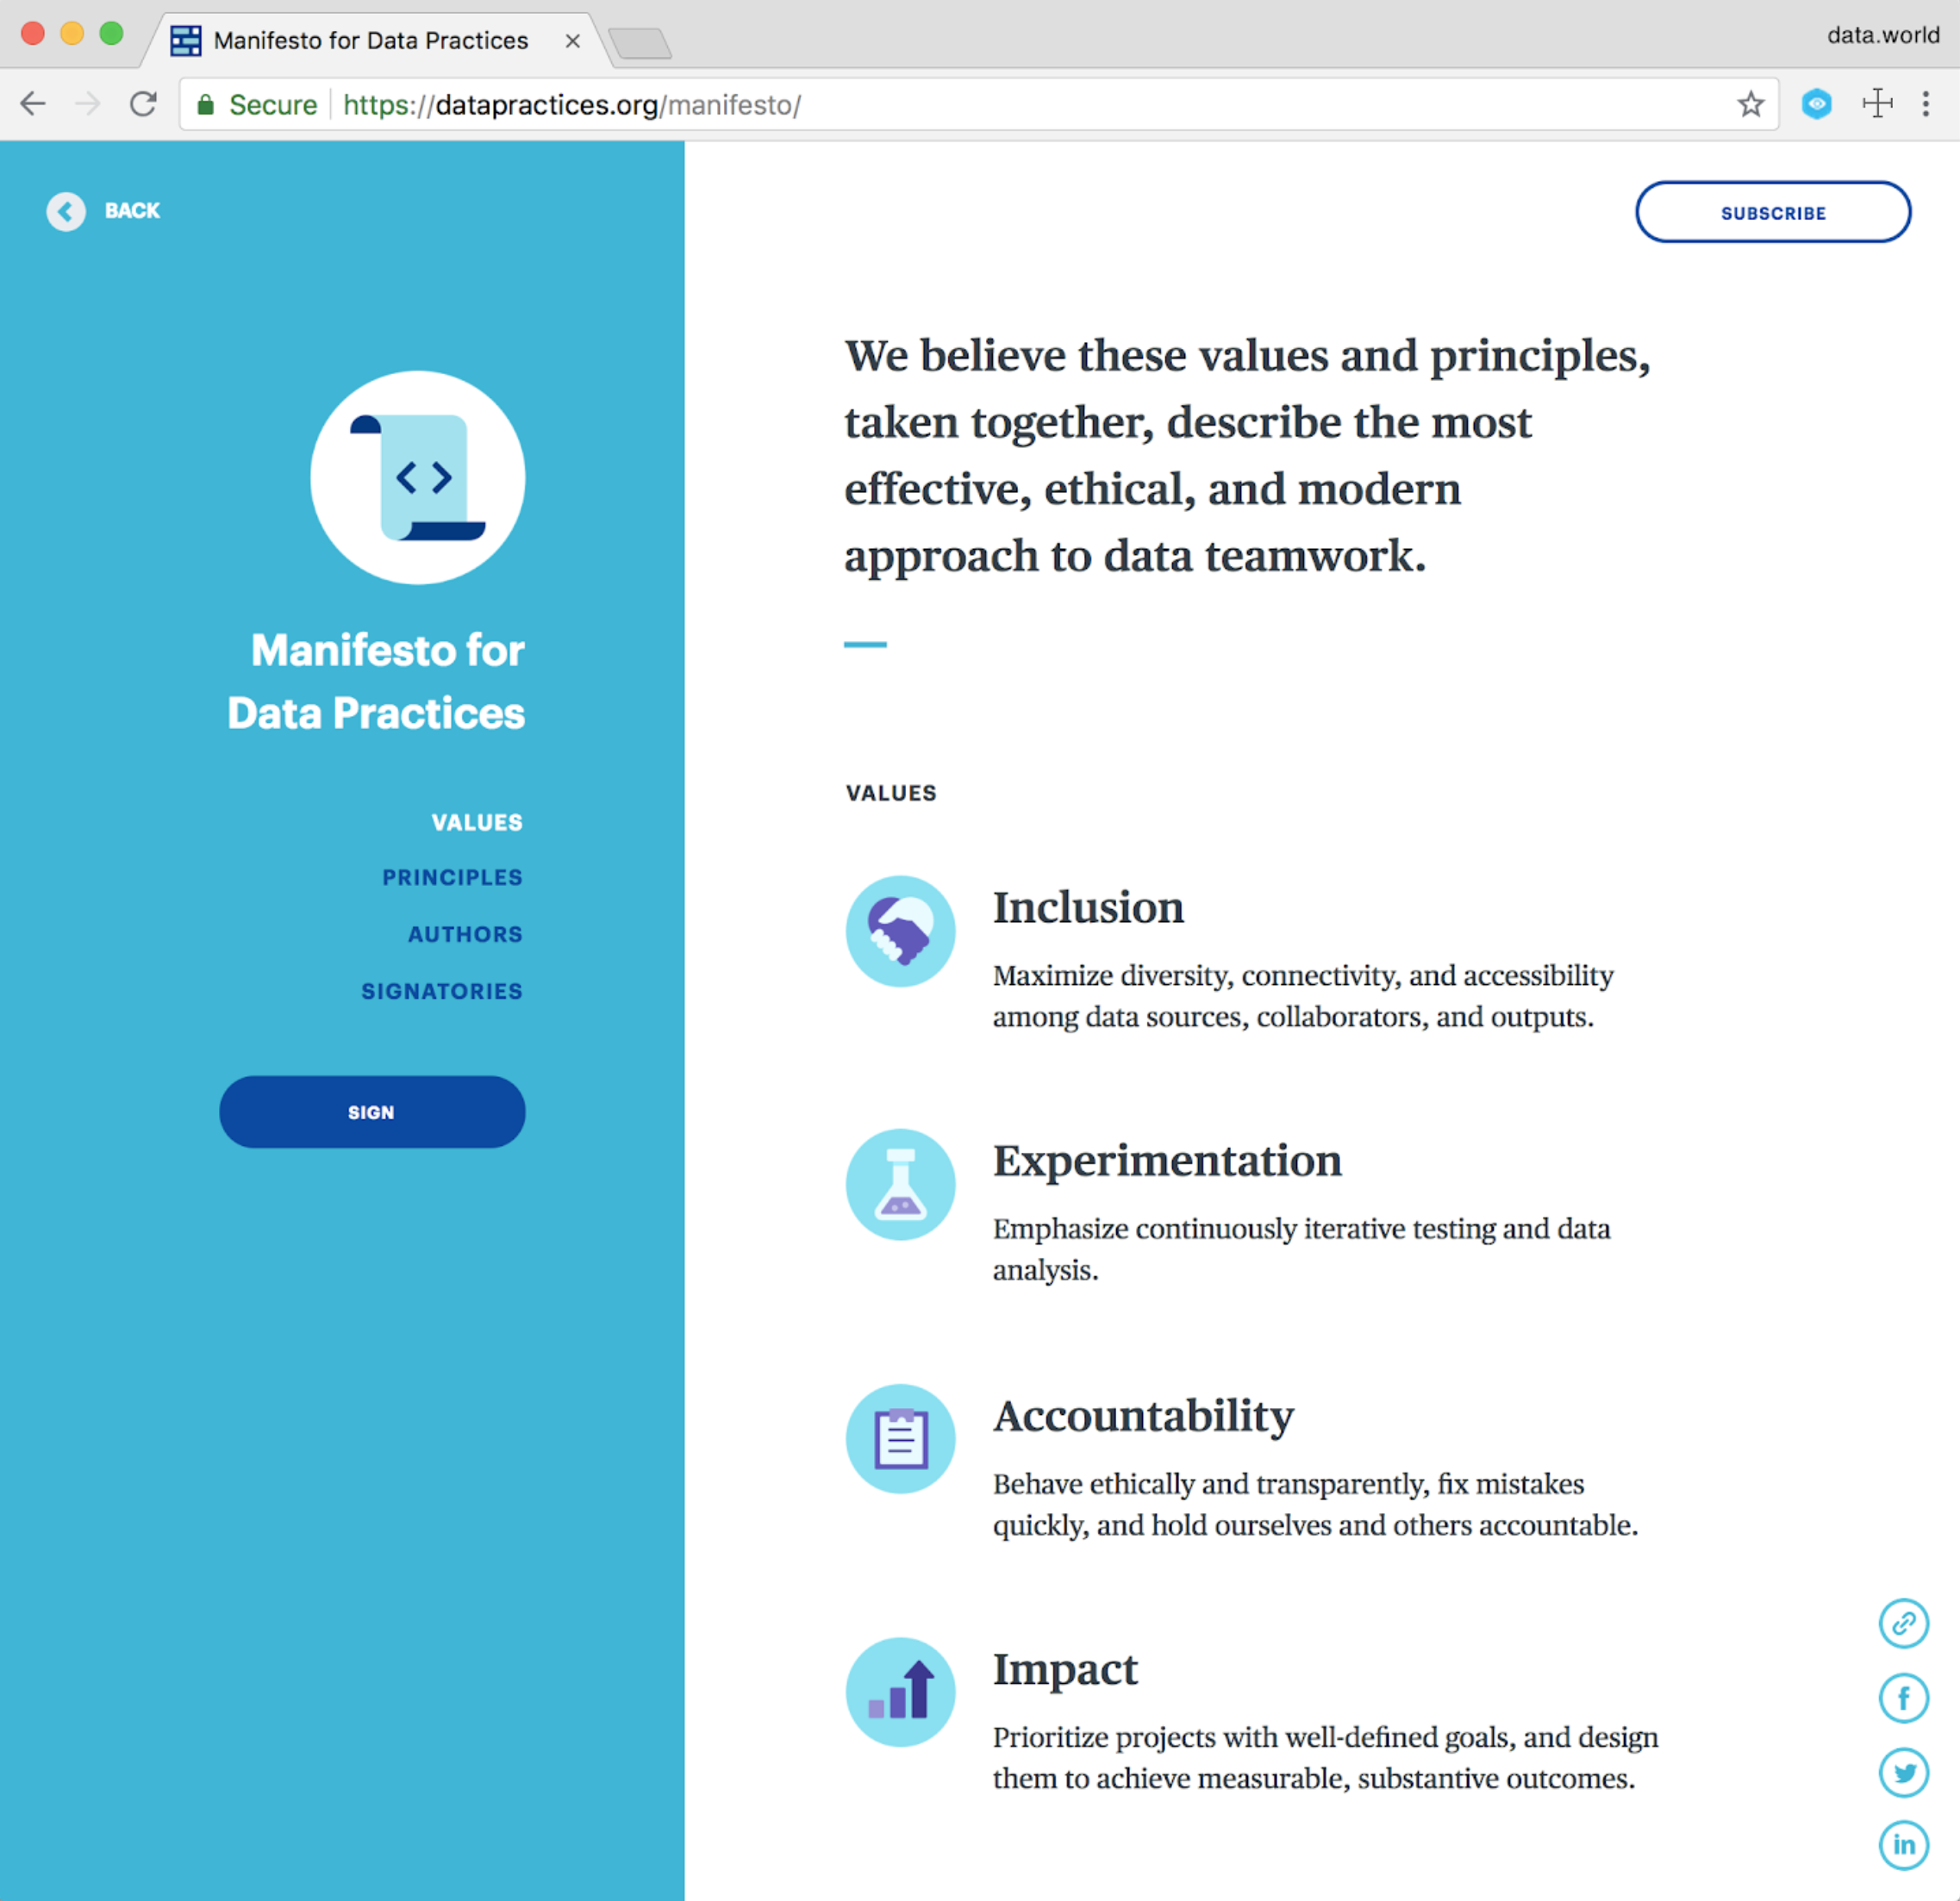

Inclusion
Maximize diversity, connectivity, and accessibility, amoung data sources, colaboration, and outputs.
Experimentation
Ephasise continuously iterative testing and data analysis.
Experimentation
Ephasise continuously iterative testing and data analysis.
Experimentation
Ephasise continuously iterative testing and data analysis.
39 authors, including:
1,300+ signatories, including:
Manifesto for Data Practices
Data Teamwork Exercises
Your data toolchain + data.world
How can we bring Design Thinking to data teams?
How can cross-functional teams work together to create better data projects and practices?

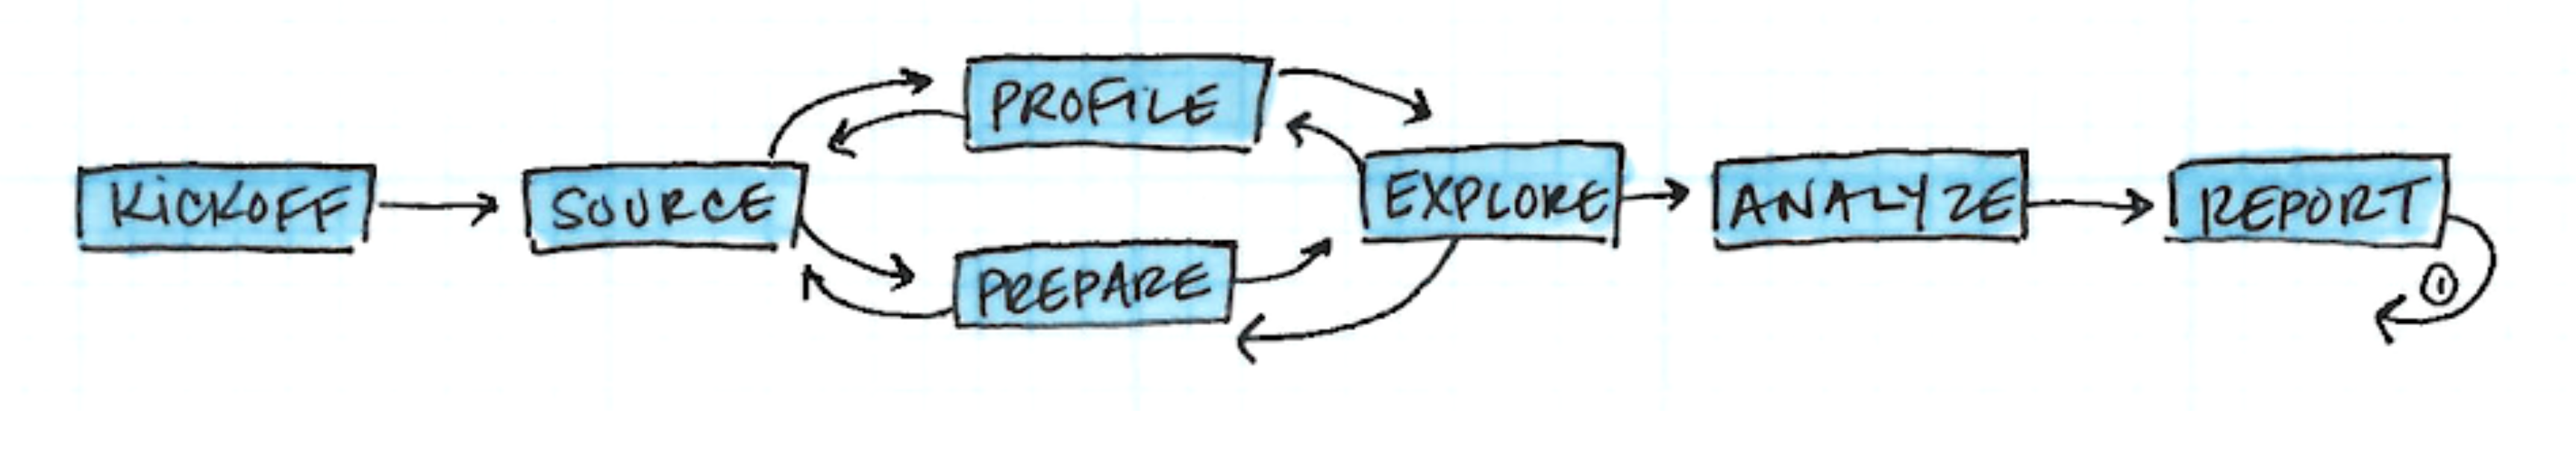
Kickoff
Start a new project with a question, problem, or dataset.
Source
Gather data sources, documentation, research, and team.
Profile
Define the data’s shape, features, and any limitations.
Prepare
Clean, munge, and wrangle the data into a usable form.
Explore
Develop a deeper understanding by querying, visualizing.
Analyze
Answer questions and build models in a reproducible way.
Deliver
Share output with stakeholders, report discoveries.
Start a project with a good question.
Consider stakeholders’ points of view.
Inclusion
Maximize diversity, connectivity, and accessibility, amoung data sources, colaboration, and outputs.
Experimentation
Ephasise continuously iterative testing and data analysis.
Experimentation
Ephasise continuously iterative testing and data analysis.
Experimentation
Ephasise continuously iterative testing and data analysis.
Nominate a team lead.
Think about each exercise through a particular point of view (data analyst, sales/marketing lead, product owner, etc.)
Create options by brainstorming individually
Make decisions by discussing as a group
The board has asked your team to double revenue in the next 12 months.
Where do you start?
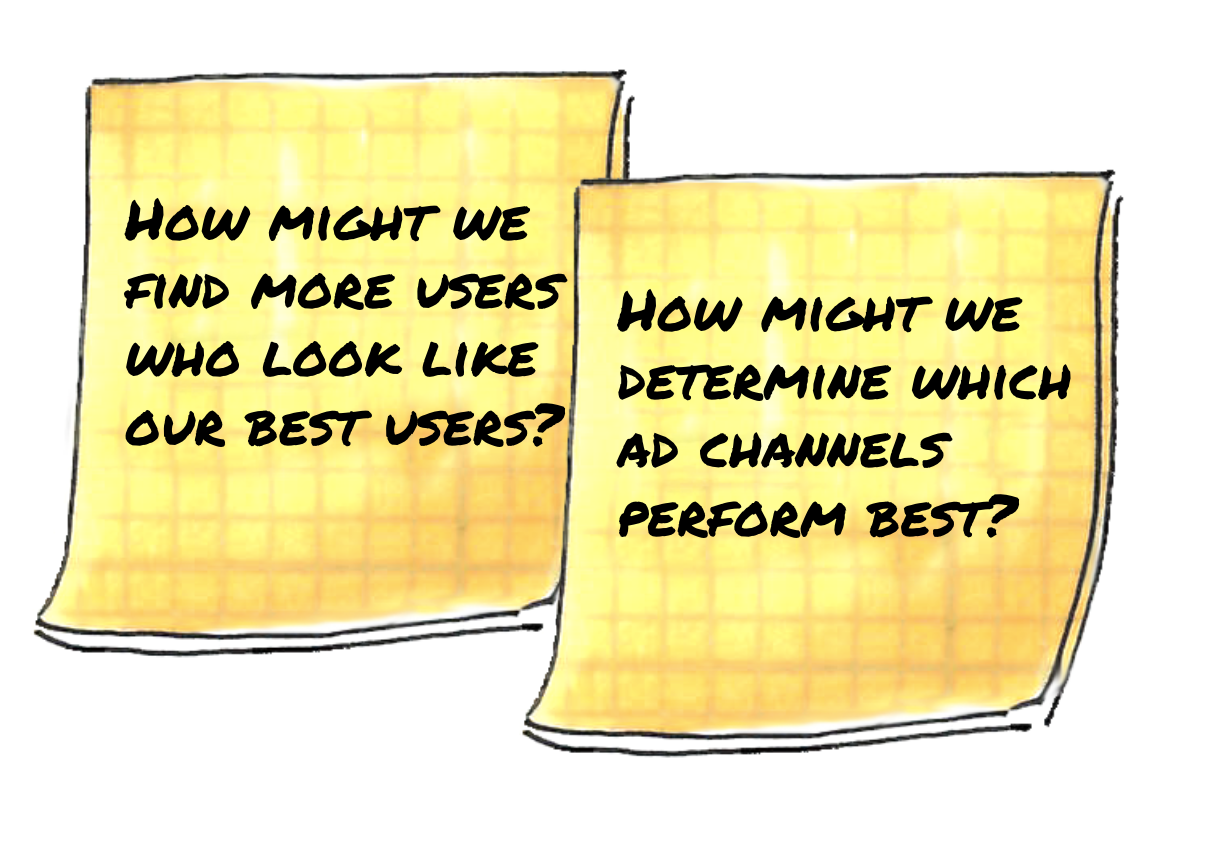
Write down ideas and questions that, if explored or answered, could help you meet your objective.
Frame questions as:“How might we…[achieve this goal]?”
Write down as many sub-questions as you can, one per post-it.

5 minute exercise
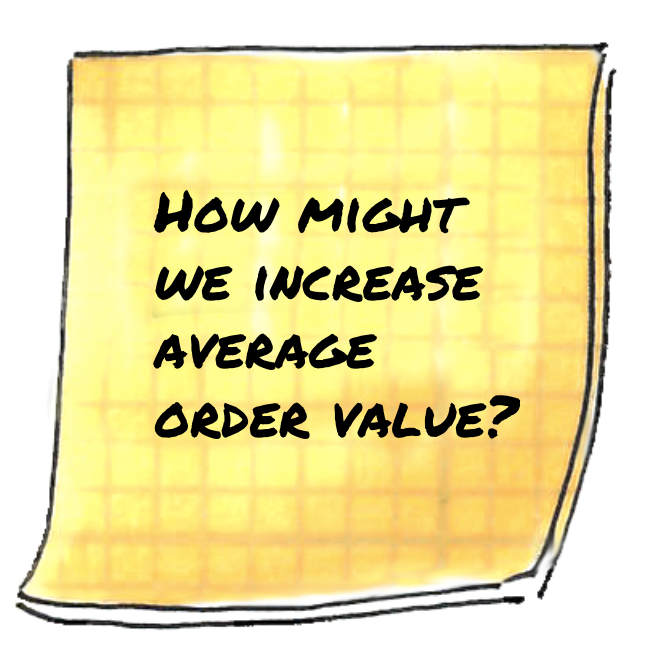
Write down as many sub-questions as you can, one per post-it.
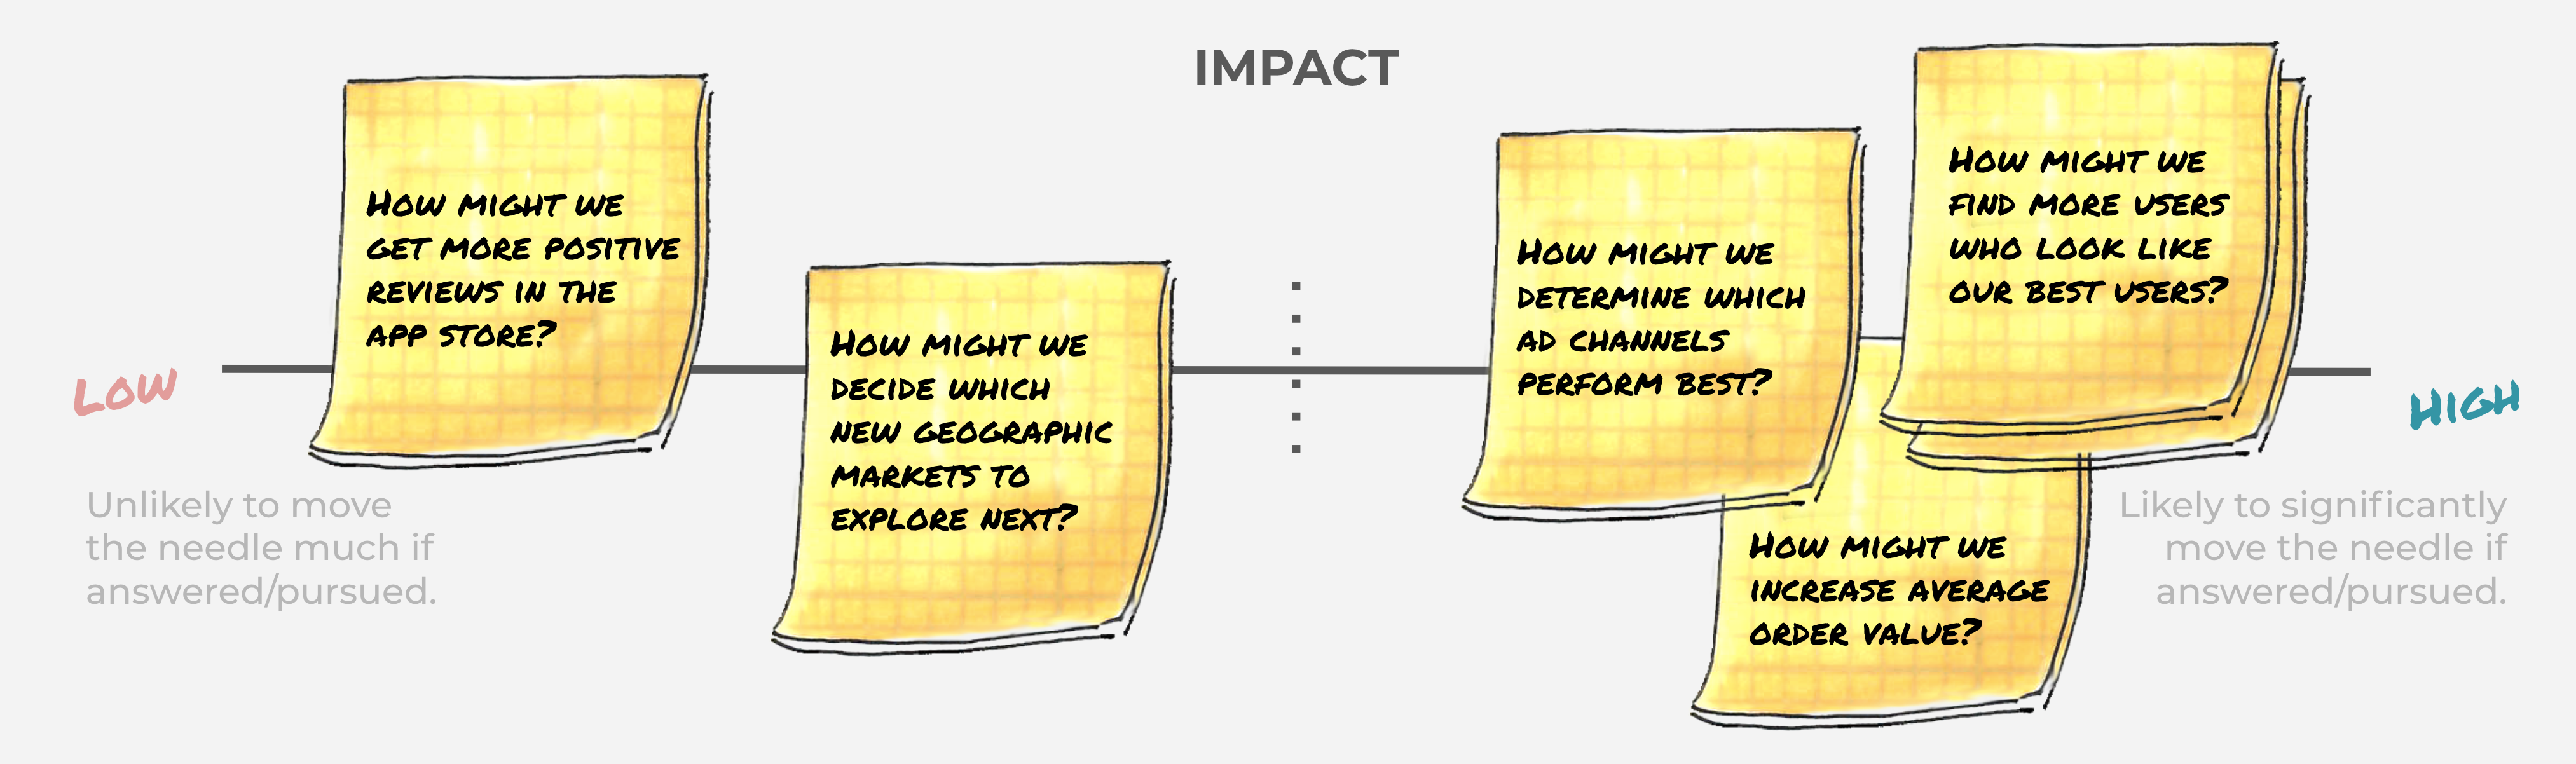
10 minute exercise
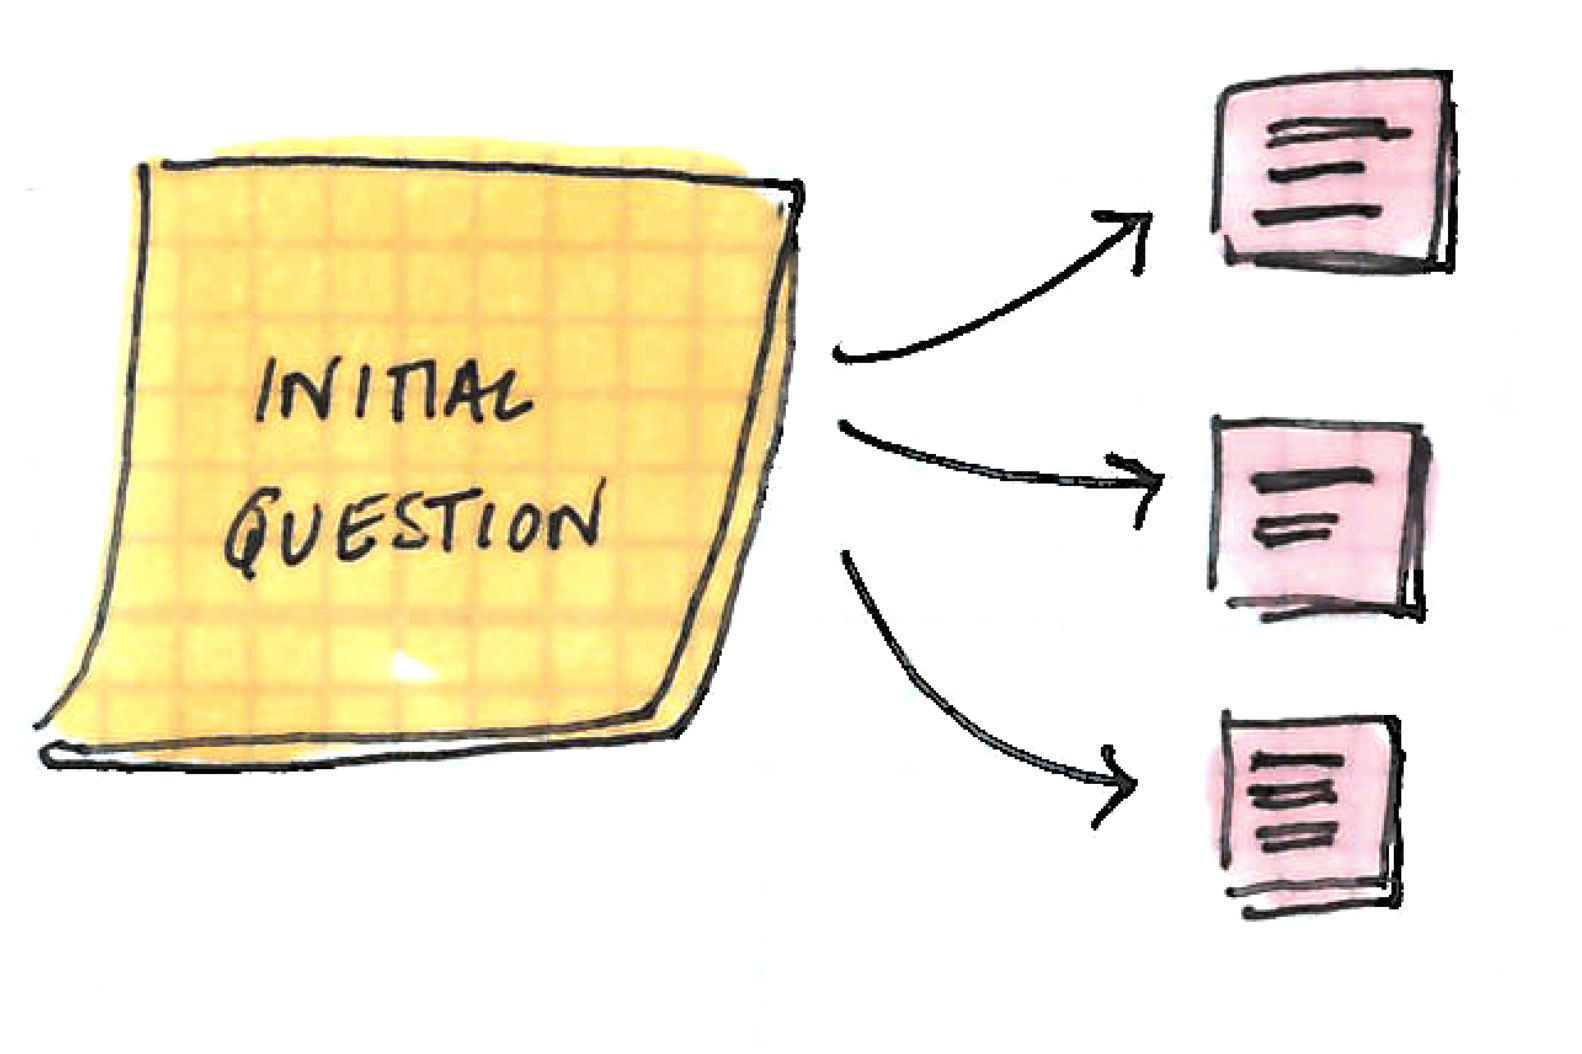
Who will be affected by each question and motivated to act by its answer? Sales? Marketing? New users.
ap only the highest impact questions to a key stakeholder.
Write down a few things each stakeholder cares about.
Cares about:
Cares about:
10 minute exercise
With your primary stakeholder in mind, clarify any ambiguities in each high impact question.

Nebulous! perform in what sense?
Clearer, but over what time period?
All-time data is not helpful
CPA fluctuation
Seasonality
Format changes
Winner
Can I imagine any part of this idea or question being misinterpreted by another stakeholder?
Have I defined all ambiguous terms?
Am I being concise?
Is this question really multiple questions?
Is the intent of my question clear?
Is this a question that can be answered with available data?
10 minute exercise
We’re almost ready to kick off a productive data project, we just need a vision of what our end result should look like.
Cares about:

Now that you’ve refined your questions with your primary stakeholder in mind, what’s the best way to visualize* answers and output with them.
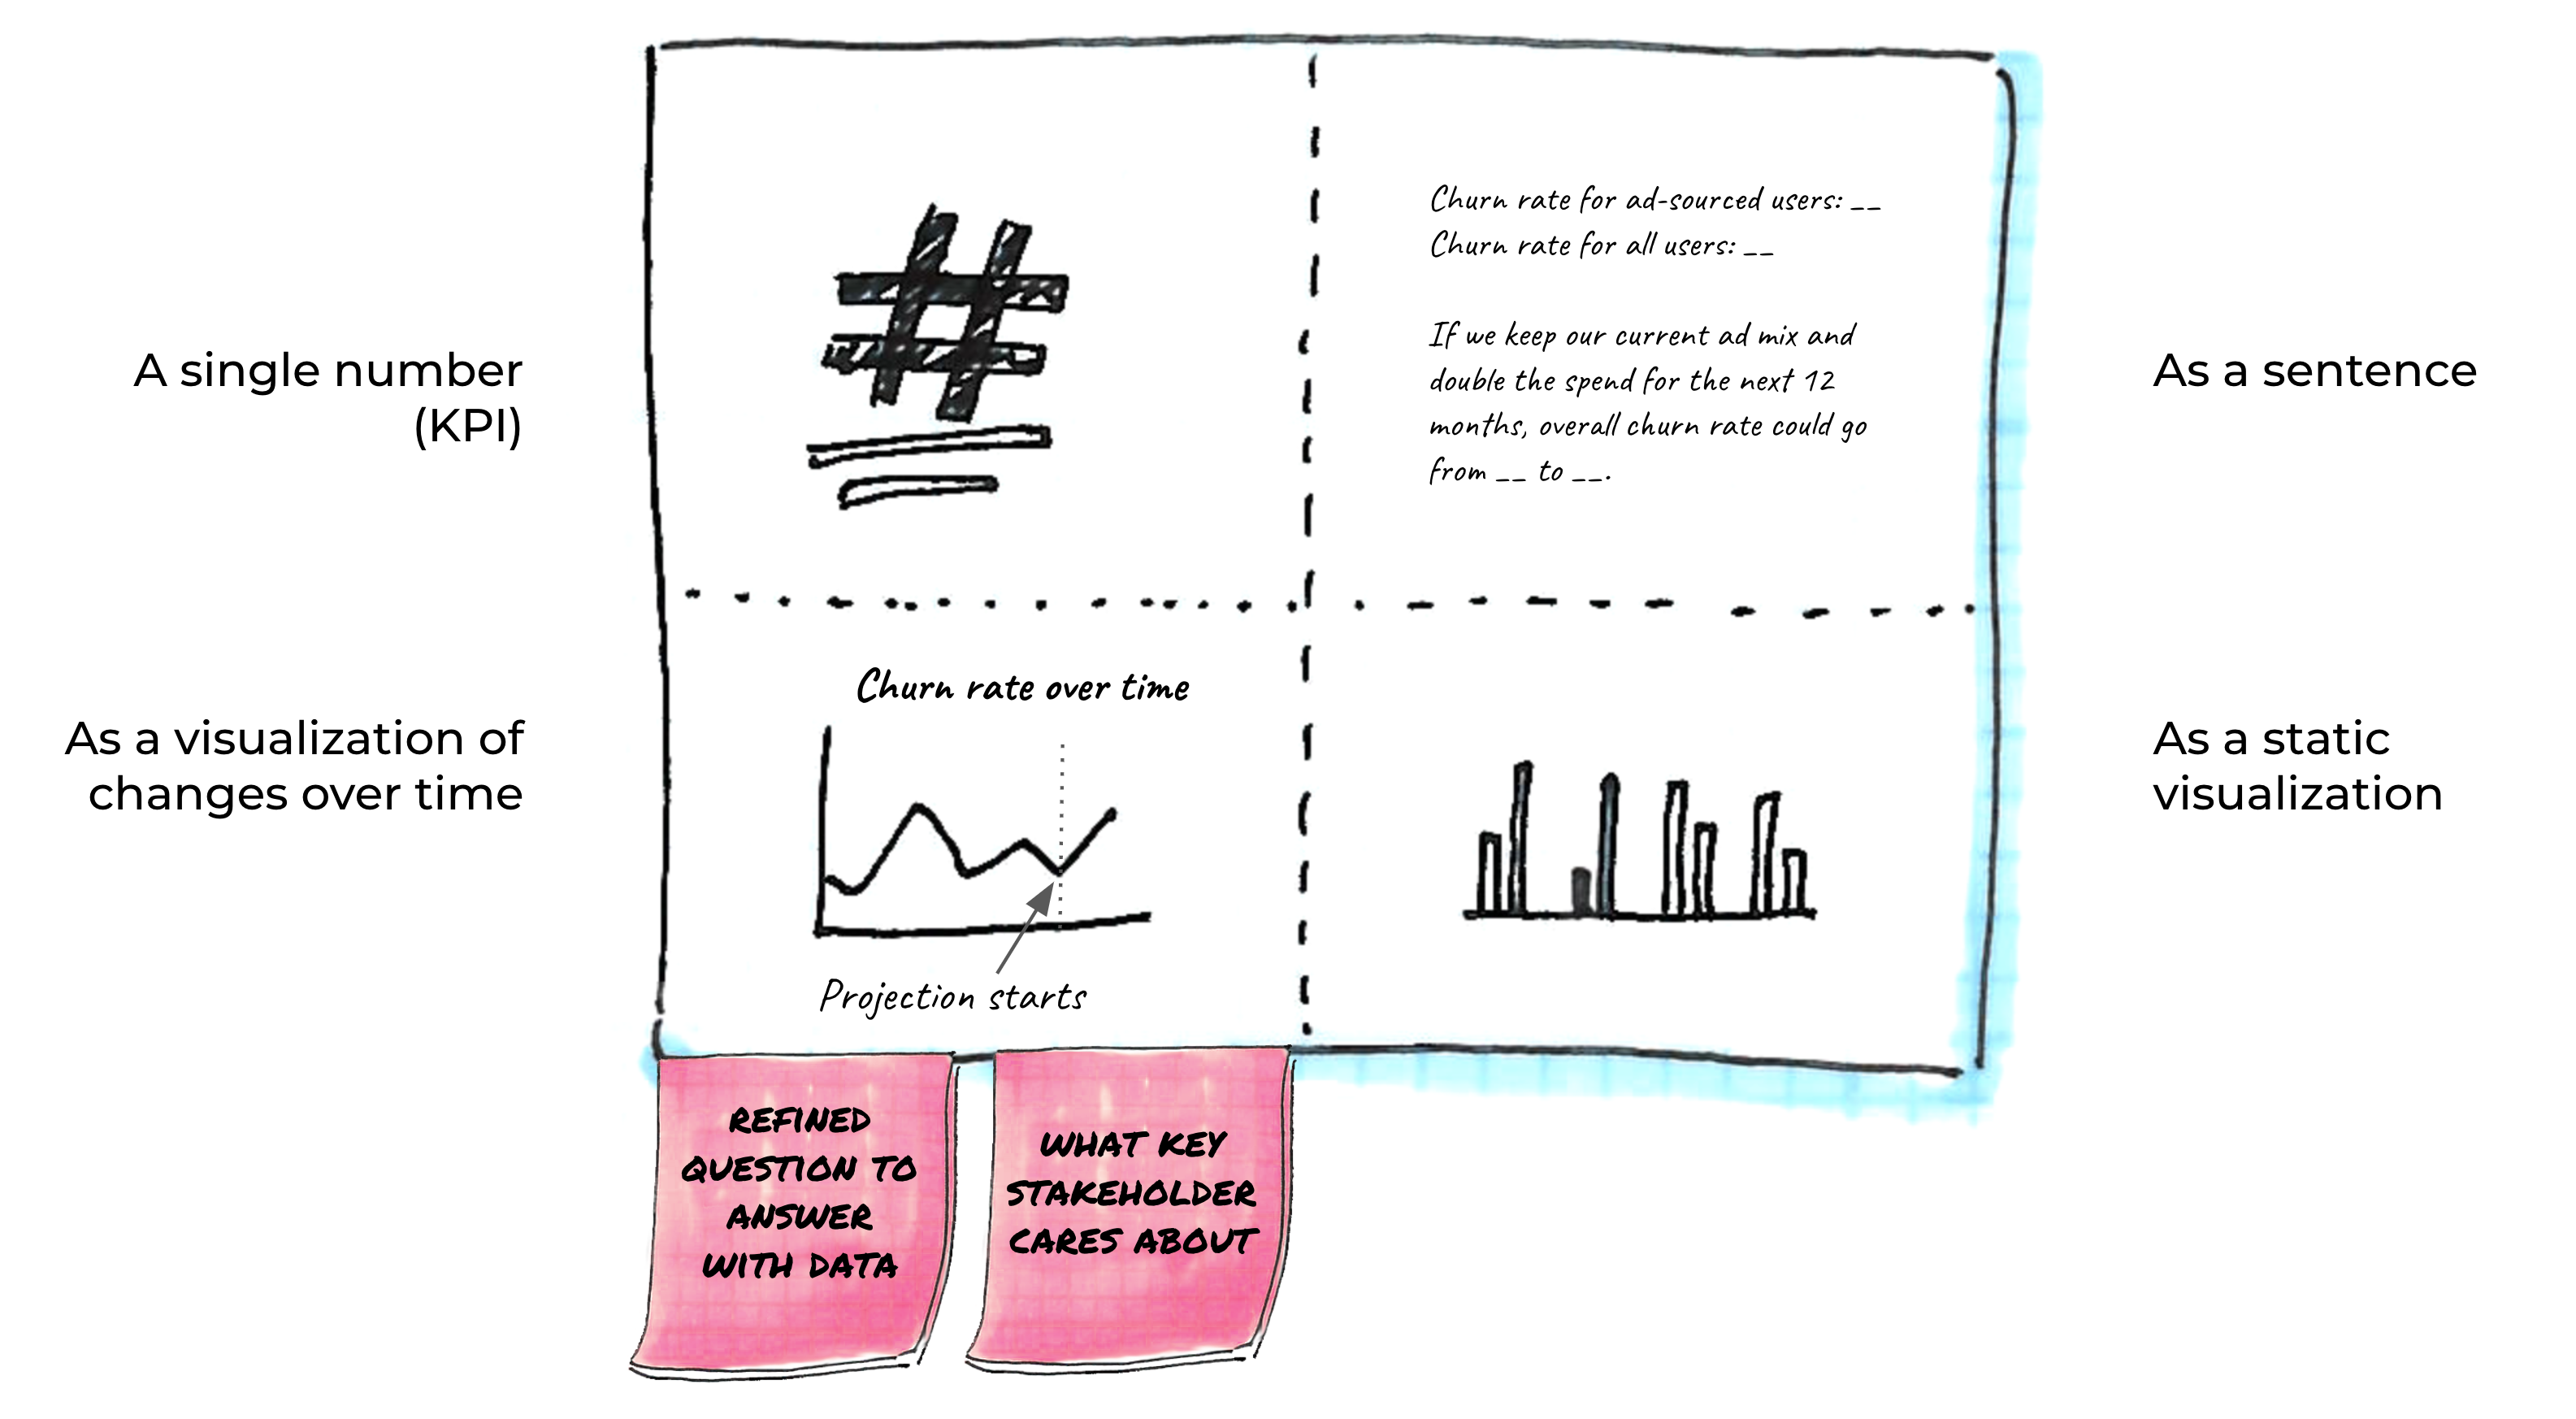
What’s the best medium for communicating with this audience?
Is the result best conveyed as a chart? A single number? A new process? A story?
What level of detail do they want/need? How technical is your audience? How busy?
What’s the single most important metric? How do we define success (and failure)?
What comparisons make sense?
Do you need to see changes over time?
5 minute exercise
What similarities do you see?
What are the strengths of each representation? What are the shortcomings?
What additional context will the stakeholders need to understand the representations?
What do the stakeholders expect?
What representations would be best for the largest number of stakeholders?
10 minute exercise
Original question
Key stakeholder + concerns
Refined question
Proposed representation
Kickoff
Start a new project with a question, problem, or dataset.
Source
Gather data sources, documentation, research, and team.
Profile
Define the data’s shape, features, and any limitations.
Prepare
Clean, munge, and wrangle the data into a usable form.
Explore
Develop a deeper understanding by querying, visualizing.
Analyze
Answer questions and build models in a reproducible way.
Deliver
Share output with stakeholders, report discoveries.