 Back to courseware
[Use arrow keys to navigate, "s" to show speaker notes, and "f" for fullscreen.]

(Yes, even you "non-technical" folks in the back)
Just like it sounds, it is a question that you are asking your data source that returns (if you asked nicely enough) the data that you want, without all the rest of the clutter.
If you are a beginner, we'll be starting with SQL. This Structured Query Language is the standard language for relational databases. So naturally there are a ton of variants and subtle differences to trip you up.
If SQL is old hat for you, you can try your hand at SPARQL as we go. This query language is for knowledge graphs and the semantic web. Welcome to the future! (wooshing sound)
Dear Database, please give me all the names of people in my address book.
SELECT names FROM address_book;
In alphabetical order?
SELECT names FROM address_book ORDER BY names ASCENDING;
How many are there?
SELECT COUNT(names) FROM address_book;
Dear Semantic Web, please give me all the names of people in my address_book.
SELECT ?names FROM ?address_book
In alphabetical order?
SELECT ?names FROM ?address_book ORDER BY ASC(?names)
How many are there?
SELECT (count(distinct ?names) as ?count)
        FROM ?address_book


A broad term applied to statistical analysis techniques used to capture a representative subset ("sample") of data points to identify patterns and allow study of the larger dataset ("population") without the overhead of oppressive amounts of data.
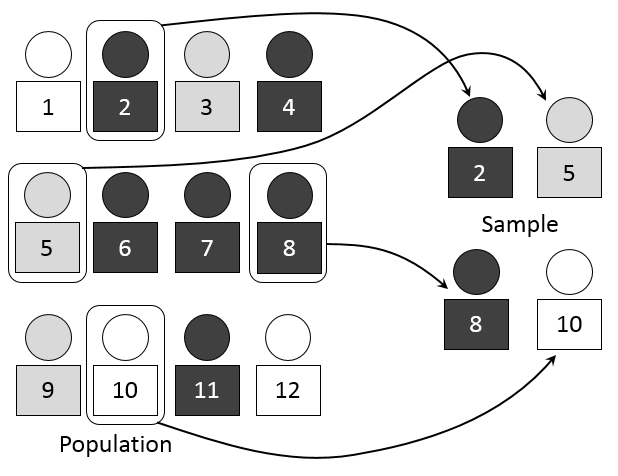
"Drawing Names from a Hat"
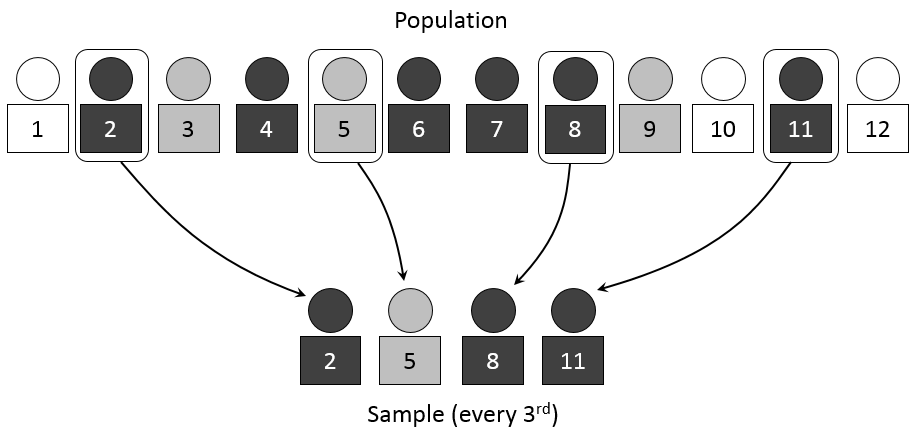
"Count Off"
(list 1,2,3,4,1,2,3,4)
Select "all the 4s"

"Take the first data I encounter"
Easiest and Worst
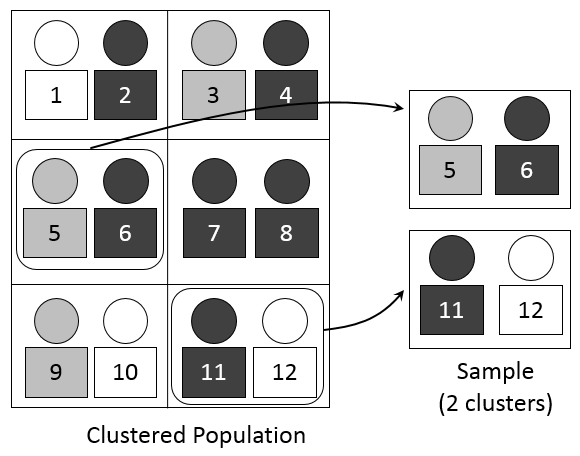
"Group populations together" (often by geo)
Select some of these complete groups
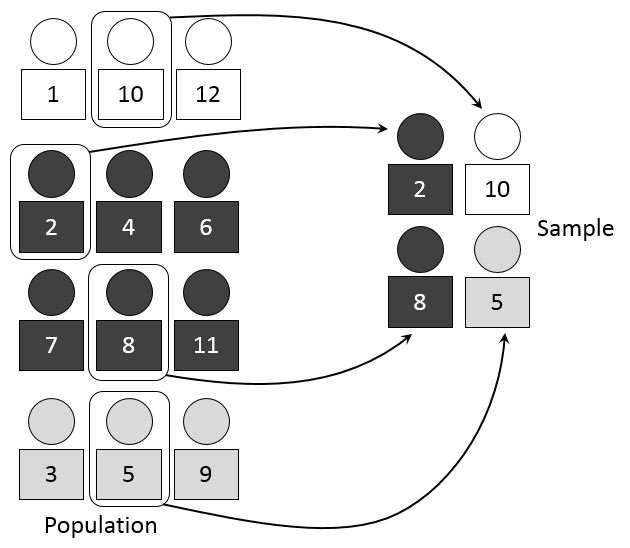
"Combining methods"
Divides population into groups ("strata") by some characteristic (ex: sex, race, etc)
A sample is taken from each group using Random, Systemic, or Convenience



Exploratory visualization is when a user has no set goal or outcome in mind. You use this technique when you don't know what is in the data and are seeking to understand the data better and uncover patterns in the overall data.
This is contrasted with explanatory visualization where you already know what is in the data and are seeking to tell that story to a specific audience. While the exploratory viz is done during this exploration phase, explanatory viz is done during the reporting phase and should be designed to highlight the specific story that you wish to tell.


"Sta-tis-tics: the only science that enables different experts using the same figures to draw different conclusions."
--Evan Esar, prolific epigramologist
"Feature engineering is the science (and art) of extracting more information from existing data. You are not adding any new data here, but you are actually making the data you already have more useful.
For example, let's say you are trying to predict foot fall in a shopping mall based on dates. If you try and use the dates directly, you may not be able to extract meaningful insights from the data. This is because the foot fall is less affected by the day of the month than it is by the day of the week. Now this information about day of week is implicit in your data. You need to bring it out to make your model better."
(https://www.analyticsvidhya.com/blog/2016/01/guide-data-exploration/#four)
Dataset:
https://data.world/jryan/try-it-out-data-matching-sample-data

