Data Practices:

1.4 Data Exploration

[Use arrow keys to navigate, "s" to show speaker notes, and "f" for fullscreen.]

PDF Print

With Notes

Topics Covered

  1. Establish / Refine Hypothesis
  2. Queries for everyone
  3. Data Sampling
  4. Analysis Methods
  5. Exploratory Visualization
  6. Beyond Statistics
  7. The are of feature engineering

Establish / Refine Hypothesis

  • Your questions, and profiling should give you a good feel for the data
  • Now it's time to create a hypothesis to test (if you haven't already)
  • Don't be afraid to make bold claims, your hypothesis can (and almost certainly will) change
  • As you explore the data, be open to it creating new hypotheses
  • Feel free to test using informal (ex: data visualization) or formal (statistical tests/models) techniques to (in)validate and evolve quickly

Queries for Everyone

(Yes, even you "non-technical" folks in the back)

What is a query?

Just like it sounds, it is a question that you are asking your data source that returns (if you asked nicely enough) the data that you want, without all the rest of the clutter.

If you are a beginner, we'll be starting with SQL. This Structured Query Language is the standard language for relational databases. So naturally there are a ton of variants and subtle differences to trip you up.

If SQL is old hat for you, you can try your hand at SPARQL as we go. This query language is for knowledge graphs and the semantic web. Welcome to the future! (wooshing sound)

The Anatomy of a Query

SQL

Dear Database, please give me all the names of people in my address book.

SELECT names FROM address_book;

In alphabetical order?

SELECT names FROM address_book ORDER BY names ASCENDING;

How many are there?

SELECT COUNT(names) FROM address_book;

SPARQL

Dear Semantic Web, please give me all the names of people in my address_book.

SELECT ?names FROM ?address_book

In alphabetical order?

SELECT ?names FROM ?address_book ORDER BY ASC(?names)

How many are there?

SELECT (count(distinct ?names) as ?count) 
        FROM ?address_book

Exercise 1: Playing with Queries

  1. https://data.world/shad/cookies
  2. "Add to Project"
  3. "Create New Project" (Call it 'Data Exploration')
  4. Beginner/Intermediate: "+Add" -> SQL Query
  5. Advanced: "+Add" -> SPARQL Query
  6. Try:
    • All data (SELECT * FROM cookies)
    • First 5 responses
      (SELECT * FROM cookies ORDER BY timestamp LIMIT 5)
    • How many rows are there?
    • How many different kinds of cookies are there?
    • How long was the survey open?
  7. https://docs.data.world/documentation/sql/concepts/basic/intro.html

Data Sampling

What is Sampling

A broad term applied to statistical analysis techniques used to capture a representative subset ("sample") of data points to identify patterns and allow study of the larger dataset ("population") without the overhead of oppressive amounts of data.

Types of Sampling

Random

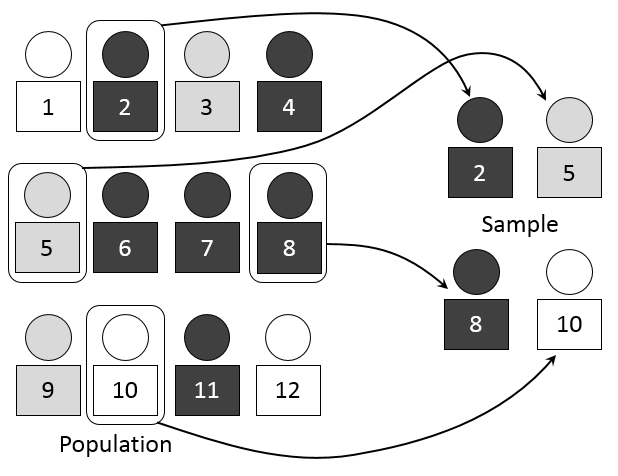
"Drawing Names from a Hat"
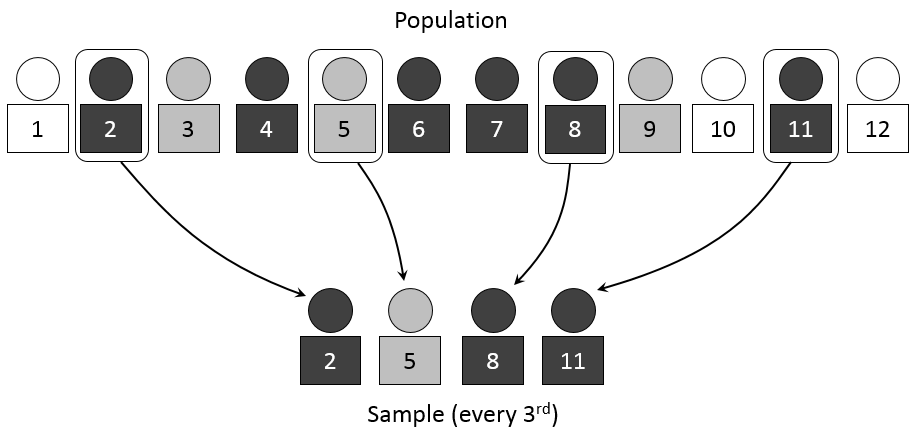
Systemic

"Count Off"

(list 1,2,3,4,1,2,3,4)

Select "all the 4s"

Convenience

"Take the first data I encounter"

Easiest and Worst

Cluster

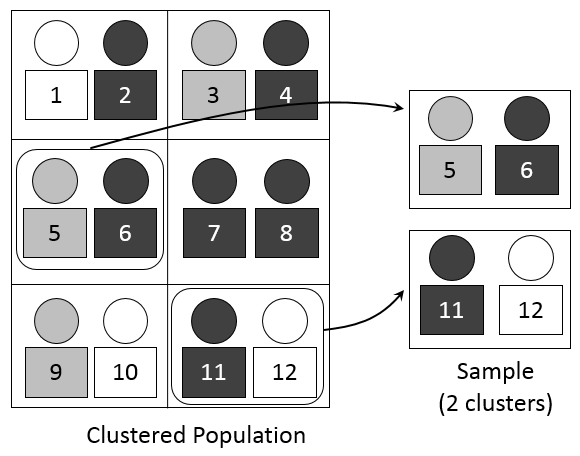
"Group populations together" (often by geo)

Select some of these complete groups

Stratified

"Combining methods"

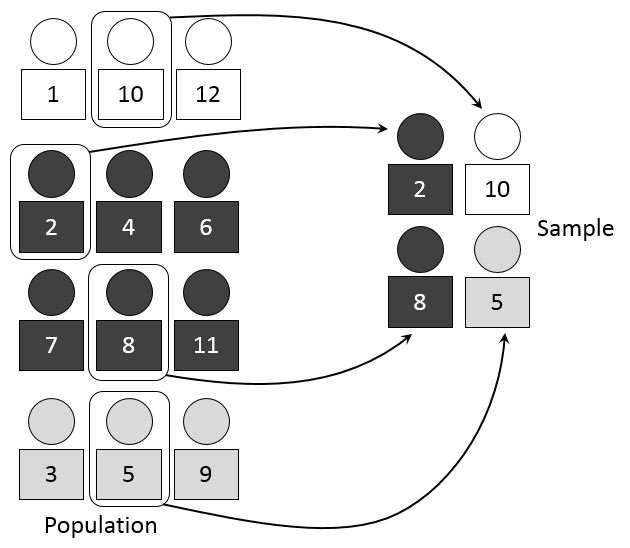
Divides population into groups ("strata") by some characteristic (ex: sex, race, etc)

A sample is taken from each group using Random, Systemic, or Convenience

Analysis Methods

Univariate

  • Examines variables one at a time
  • Good for finding:
    • Counts
    • Distribution
    • Other simple analysis

Bivariate

  • Find the relationship between two variables
  • Look for relationship (or lack thereof) between variables
  • Numerical & Numerical
    • Visual -- Scatter plot
    • Math class! -- Linear correlation
  • Categorical & Categorical
    • Visual -- Stacked Column / Combination Charts
    • Math Class! -- Chi-square Test
  • Categorical & Numerical
    • Visual -- Line Chat w/ Error Bars / Combination Chart
    • Math Class! -- Z-test / t-test / Analysis of Varience (ANOVA)

Outliers and you!

  • Detecting

    • Box plot
    • Histogram
    • Scatter plot
  • Removing

    • Deleting
    • Transforming / binning
    • Imputing
    • Separating

Exploratory Visualization

What is Exploratory Viz?

Exploratory visualization is when a user has no set goal or outcome in mind. You use this technique when you don't know what is in the data and are seeking to understand the data better and uncover patterns in the overall data.

This is contrasted with explanatory visualization where you already know what is in the data and are seeking to tell that story to a specific audience. While the exploratory viz is done during this exploration phase, explanatory viz is done during the reporting phase and should be designed to highlight the specific story that you wish to tell.

Exploratory Viz (High Level)

  • Process
    • High level overview
    • Zoom and tweak
    • Extract detail
  • Popular Techniques
    • Bar / Line Graph
    • Scatter plot
    • Bubble chart

Exercise 2: Pretty Pictures!

  1. Create new dataset on data.world (Pretty Pictures!)
  2. Data: https://goo.gl/4yBGZz
  3. "Download" button -> "Save to dataset or project"
  4. Search for "Pretty Pictures" dataset you created
  5. "Save" and "Open in a new tab"
  6. Using top right dropdown open in a visualization tool
    • Chart Builder (included)
    • Tableau Public (free download at https://public.tableau.com/en-us/s/ )
    • Excel
  7. Tell a story with the data!

Beyond Statistics

"Sta-tis-tics: the only science that enables different experts using the same figures to draw different conclusions."

--Evan Esar, prolific epigramologist

  • Why summary stats shouldn't be the only thing you look at
    • Understand the progression of the data
    • Provenance is important!
    • The more you learn about stats, the more you can make them do your bidding (and trust them less)
  • Do I really need rigorous statistical examination?
    • In a word, "no"
    • Most are capable of far deeper analysis that then give themselves credit for
    • Example: Pivot Tables

Feature Engineering

"Feature engineering is the science (and art) of extracting more information from existing data. You are not adding any new data here, but you are actually making the data you already have more useful.

For example, let's say you are trying to predict foot fall in a shopping mall based on dates. If you try and use the dates directly, you may not be able to extract meaningful insights from the data. This is because the foot fall is less affected by the day of the month than it is by the day of the week. Now this information about day of week is implicit in your data. You need to bring it out to make your model better."

(https://www.analyticsvidhya.com/blog/2016/01/guide-data-exploration/#four)

Exercise 3: Semantic Expansion

Dataset:
https://data.world/jryan/try-it-out-data-matching-sample-data

  1. Click "add to project" button
  2. Create a new data project
  3. Notice that zip_code is already "matched"
  4. Click the dropdown on 'county_name' (green triangle indicates matchability)
  5. Select "Match this column"
  6. Add the matched semantic column
  7. Add additional columns that can be inferred from this semantic knowledge
  8. Extra credit: upload your own data and try it out. You can match on things like:
    • Geo (ex: zip, coutry, county, province, state)
    • ICD10 codes
    • NAICS (North American Industry Classification System)

Establish / Refine Hypothesis (redux)

  • Your questions, and profiling should give you a good feel for the data
  • Now it's time to create a hypothesis to test (if you haven't already)
  • Don't be afraid to make bold claims, your hypothesis can (and almost certainly will) change
  • As you explore the data, be open to it creating new hypotheses
  • Feel free to test using informal (ex: data visualization) or formal (statistical tests/models) techniques to (in)validate and evolve quickly
  • Once you cycle through some exploration it should naturally transition to full-blown analysis

Want to run a workshop like this at your company?

community@data.world


Don't forget to sign the values and principles! https://datapractices.org/manifesto