Data Practices:

1.5 Analyze and Report

[Use arrow keys to navigate, "s" to show speaker notes, and "f" for fullscreen.]

PDF Print

With Notes

Topics Covered

  1. Ask
    • Evolve Your Hypothesis
    • Insight vs Hindsight vs Foresight
    • Tools and Processes
  2. Analyze
    • Types of Analysis
    • Governance
    • Introduction to Modeling
    • Notebooks and You!
  3. Report
    • Data Storytelling
    • Matching Reporting to Your Audience
    • Building Diversity of Outputs
    • Data Visualization

Exercise 0: Setting a Baseline

  • Hypothesis
    • Do you have one? (You should, especially if you used 1.4)
    • Requires baseline knowledge
    • Should be testable
  • How does your data model / infrastructure support your analysis?
    • If you need to refine or alter data sources, can it be easily refreshed?
    • Do you have all the necessary context to provide complete answers?
  • What sort of tools / processes are in place?
    • R / Python
    • Exploratory vis VS Reporting
    • Data Catalog / ETL / etc
    • Building semantic relationships

Ask

Refining Your Hypothesis (from 1.4)

  • Your questions, and profiling should give you a good feel for the data
  • Now it’s time to create a hypothesis to test (if you haven’t already)
  • Don’t be afraid to make bold claims, your hypothesis can (and almost certainly will) change
  • As you explore the data, be open to it creating new hypotheses
  • Feel free to test using informal (ex: data visualization) or formal (statistical tests/models) techniques to (in)validate and evolve quickly
  • Once you cycle through some exploration it should naturally transition to full-blown analysis

Hindsight VS Insight VS Foresight

Process

  • This process is one of many, don't take any one of them as gospel!
  • Look for similarities and adapt the best parts, for you, as you see fit

Tools

Low-Level

  • Python / Pandas
  • R
  • SQL

Pipeline / Modeling

  • DataFlow
  • AWS Lambda
  • SAS

Visualization

  • Tableau
  • Power BI
  • Data Studio

Non-Programming

  • RapidMiner
  • DataRobot
  • BigML
  • Google Cloud AutoML
  • Excel

Semantic

  • data.world
  • Pool Party
  • SKOS Shuttle

Exercise 1: Build Your Process

  • Do you fit a model? Example:
    1. Kickoff
    2. Source
    3. Profile
    4. Prepare
    5. Explore
    6. Analyze
    7. Report
  • What adjustments (additions? deletions?) need to be made?
  • Do you have tooling that supports each step?

Analyze

Types of Analysis

Related to the notion of Hindsight, Insight, and Foresight, you can classify types of analysis in four main categories:

Descriptive

Analyze what is happening now and in the past by characterizing data and uncovering patterns

Diagnostic

Determine what happened and why, determine the causal and correlative relationships between variables and outcomes

Predictive

Forecast future events based on extrapolating from past data

Prescriptive

Determine next steps, recommend actions to take to achieve a specific outcome

Governance

Data Governance is the practice of ensuring the usability, quality, security, and availability of data within an organization.

  • Data Stewards determine data policies and set forth a plan to enforce compliance with those policies
  • Data Quality references the provenance (where did this data come from), completeness, accuracy, and fitness-to-purpose for a particular dataset
  • Master Data Management is a component of data governance that maintains the "official" reference copy of data to ensure consistent application across the organization

An Introduction to Modeling

  • This can blend with “feature engineering” from data exploration
  • Can be simple (m.fit(X,y) / button click) or very complex (weeks of iterations/experiments)
  • Focus on reproducibility!
  • Example: Iris scanner
    • Try out many models / parameters
    • Designing neural-network-based image classification model (Use experiment mgmt tool - ex: modelDB, tensorboard, sacred, FGLab, Hyperdash, FloydHub, Comet.ML, DatMo, MLFlow…. To record learning curves and results)
    • Implement your whole pipeline using makefiles or a workflow engine
  • Consider model deployment as a discrete step, with its own challenges

Notebooks and You!

"The Jupyter Notebook is an open-source web application that allows you to create and share documents that contain live code, equations, visualizations and explanatory text. Uses include: data cleaning and transformation, numerical simulation, statistical modeling, machine learning and much more."� --Project Jupyter

  • Iterative
  • Repeatable
  • Transparent
  • An invitation to experiment!

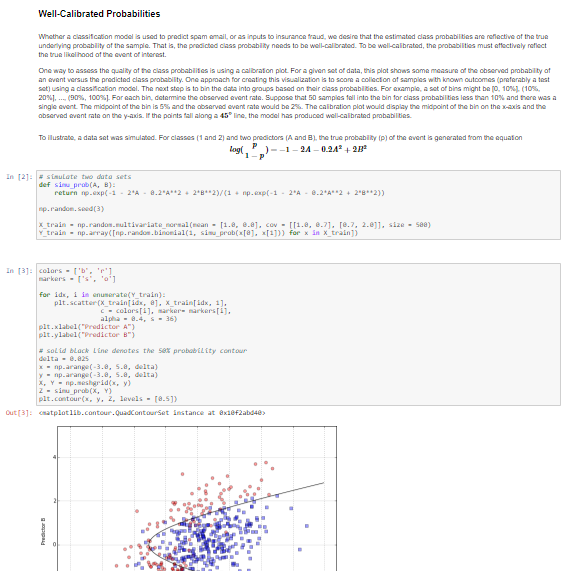
Example: Applied Predictive Modeling with Python (next slide)

Notebook View

Exercise 2: Notebook Exploration

  • Notebook Exercise:
    https://data.world/dpe/notebook-exercise
  • Read through the notebook and see how much you can understand
  • You don't need to understand the plumbing to change (or learn from) the analysis
  • Demo of working with the notebook

Report

Data Storytelling

Storytelling = Visualization + Narrative + Context

“It’s the context around the data that provides value and that’s what will make people listen and engage.” --James Richardson, Senior Director Analyst, Gartner

  • Good narratives have a point of view and engage the audience across many different cognitive levels (not just analytical)
  • Make it personal! (emotional engagement)
  • Simplify with metaphor, anecdote, etc (trigger imagination)
  • Build a narrative (ex: Hero's journey)

Matching Reporting to Your Audience

  • What are my goals for this particular story? What outcome(s) am I shooting for?
  • What have I learned from the data
  • What does this mean to my organization? How does this relate to the specific audience/stakeholders I’m addressing.
  • Do I have enough data to address the question?
  • How can I express the data AND insights as simply as possible to incite action?

Building Diversity of Outputs

  • Different audiences consume data in different ways
  • Diversity in outputs helps to address different audiences where they are comfortable
  • Ex: dashboard (decision maker) VS notebook (practitioner)

Data Visualization

There are so many choices of how to represent data, how can you choose?

  • Deviation
  • Correlation
  • Ranking
  • Distribution
  • Change-over-time
  • Magnitude
  • Part-to-whole
  • Spatial
  • Flow

The vega community has a fantastic breakdown with examples and when to use each: https://goo.gl/wpeXnW

Want to run a workshop like this at your company?

community@data.world


Don't forget to sign the values and principles! https://datapractices.org/manifesto